Contact us by phone


+44(0)1403 754 416

Contact us by email

[email protected]

View UKAS Schedule

Download schedule of accreditation

Shelf life simplified: A water activity approach

Table of Contents

Shelf life simplified: A water activity approach

Application note created by Novasina AG

The shelf life of a product is defined as the practical time that it remains desirable to consumers. It dictates the radius of distribution for the product, how it must be stored, and its best by date. Failure to match this expected shelf life can result in customer complaints, product recalls, and tarnished reputation. Consequently, correctly determining the optimal production process and handling that maximizes the shelf life and then monitoring to make sure those conditions are met is the difference between profitability and lost revenue. However, correctly determining the shelf life of a product can be a challenging endeavor, often due to a lack of resources and clear guidelines for conducting shelf life testing. The shelf-life simplified paradigm takes a pragmatic approach to shelf life determination by using the relationship between water activity and shelf life to guide the process.

WATER ACTIVITY AND SHELF LIFE

Water activity is defined as the energy status of water in a system and is rooted in the fundamental laws of thermo-dynamics through Gibb’s free energy equation. It represents the relative chemical potential energy of water as dictated by the surface, colligative, and capillary interactions in a matrix. Practically, it is measured as the partial vapor pressure of water in a headspace that is at equilibrium with the sample, divided by the saturated vapor pressure of water at the same temperature. Water activity is often referred to as the ‘free water’, but since ‘free’ is not scientifically defined and is interpreted differently depending on the context, this is incorrect. Free water gives the connotation of a quantitative measurement, while water activity is a qualitative measurement of the relative chemical potential energy. Rather than a water activity of 0.50 indicating 50% free water, it more correctly indicates that the water in the product has 50% of the energy that pure water would have in the same situation. The lower the water activity then, the less the water in the system behaves like pure water.

Moisture content, an extensive proper-ty that determines the amount of moisture in a product is often mistakenly considered an important control point for shelf life. However, moisture content only provides a standard of identity and does not determine end of shelf life. Water activity, conversely, is closely related to all modes of failure that can lead to the end of shelf life, including microbial spoilage, texture change, staling, rancidity, and color change. As such, it is possible to determine the most likely mode of failure for a product based on its expected water activity and avoid pursuing modes of failure that are not applicable. This saves both time and resources while facilitating the establishment of the ideal water activity specification for the product. Figure 1 outlines the Shelf Life Simplified Paradigm.

SHELF LIFE SIMPLIFIED

The shelf life simplified paradigm provides a step by step process for pursuing the determination of shelf life (Figure 1).

Step 1 is to determine the expected water activity of the product. Step 2 is to determine at that water activity, what is the most likely mode of failure. The water activity range of your product will determine which modes of failure are the most likely to occur for your product.

At water activities greater than 0.85, microbial spoilage is the biggest concern. At water activities between 0.70 and 0.85, the most likely modes of failure will be either microbial spoilage or chemical instability. Between water activities of 0.40 to 0.70, the most likely modes of failure will be chemical instability, texture changes, and moisture migration. At water activities between 0.20 in 0.40 the most likely modes of failure will be texture changes or caking and clumping. Finally, at water activities less than 0.2, the main mode of failure will be chemical instability due to an increased rate of rancidity.

Once the primary modes a failure have been identified, research can be done to determine the extent of the risk and how long it will take for these modes of failure to progress enough to end the shelf life. Only the risks that are shown within the water activity range of the product need to be investigated.

Figure 1. Shelf-life simplified paradigm.

MODE OF FAILURE: MICROBIAL GROWTH

Each microorganism has an ideal internal water activity and their ability to reproduce and grow depends on maintaining that water activity. When a microorganism encounters an environment where the water activity is lower than their internal water activity, they experience osmotic stress and begin to lose water to the environment, since water moves from high water activity (energy) to low water activity (1). This loss of water reduces turgor pressure and retards normal metabolic activity. To continue reproducing, the organism must lower its internal water activity below that of the environment. It tries to achieve this by concentrating solutes internally. The ability to reduce its internal water activity using these strategies is unique to each organism. Consequently, each microorganism has a unique limiting water activity below which they cannot grow (2, 3). Notice that an organism’s ability to reproduce and grow does not depend on how much water is in its environment (moisture content or free water), only on the energy of the water (water activity) and whether it can access that water for growth. A list of the water activity lower limits for growth for common spoilage organisms can be found in Table 1. These growth limits indicate that all pathogenic bacteria stop growing at water activities less than 0.87 while the growth of common spoilage yeasts and molds stops at 0.70 aw, which is known as the practical limit. Only xerophilic and osmophylic organisms can grow below 0.70 aw and all microbial growth stops at water activities less than 0.60. Other intrinsic factors such as pH impact microbial growth as well. For a product to be considered non-potentially hazardous, it’s water activity must be less than 0.86 aw or its pH less than 4.2 to ensure that no pathogenic bacteria will be able to grow on the product as it sits on the shelf. Water activity and pH also work synergistically to provide microbial protection at values higher than those required when only one control factor is considered (4). Products with a water activity higher than 0.70 aw but less than 0.86 aw is considered shelf stable but will still support the growth of mold and yeast. Products in this range are not considered unsafe because the growth of molds and yeasts does not cause foodborne illness. However, the growth of nonpathogenic organisms does typically render the product undesirable to a consumer and is considered to have ended the shelf life of the product. The shelf life then is determined by the time needed for microbial growth to progress to a level deemed unacceptable. The kinetics of this growth is determined by the interaction of multiple growth factors including water activity as well as temperature, pH, oxygen availability, nutrient availability, and preservative concentration (4). The rate of microbial growth can be predicted through empirical models that account for the effect of each of these factors and used to predict the shelf life at a given set of conditions (5).

Water activity lower limits for growth for common spoilage organisms

MODE OF FAILURE: CHEMICAL STABILITY

The water activity of intermediate moisture and dry products will typically be less than 0.70 aw, indicating that microbial growth is not likely to occur. However, products in this range do not have unlimited shelf life. So what other modes of failure are likely to occur to end shelf life. For products in the 0.40- 0.70 aw range, chemical degradation is a strong candidate because reactions rates are at a maximum. In general, as water activity increases so do reaction rates, but lipid oxidation is unique in that the reaction rate also increases at very low water activity (6). Examples of reactions that can result in product degradation and end of shelf life include Maillard browning (changes in color and flavor), lipid oxidation (rancidity), enzymatic (changes in texture, color, and flavor), and vitamin break down (nutritional quality loss). Since intermediate moisture foods need to be at high enough water activities to keep a moist mouth feel, it is not possible to slow chemical reaction rates by lowering water activity. Instead, other interventions are typically warranted such as reformulation to remove reactants, inclusion of oxygen absorbers, or modified atmosphere packaging. When changes in flavor or odor due to chemical reactions is the mode of failure, the time required for the reaction to have progressed to the point of unacceptability at a given water activity and temperature will be the product’s shelf life. If the rate constants for these reactions at several different storage conditions are determined, a predictive model can be used to estimate the time needed for the reaction to proceed to an unacceptable level under any storage conditions. To do this, the progress of the reaction will need to be tracked using some type of quantitative assessment. Examples of methods for quantifying common reactions include:
Lipid Oxidation/Rancidity
  • Peroxide values
  • Tbar values
  • Oxygen consumption
  • Sensory
Browning Reactions
  • Color changes
  • Sensory
  • Formation of reaction products
Vitamin Loss
  • Test kits (ELISA)
  • HPLC
While there are examples of shelf life models in the literature, the only fundamental model that includes both water activity and temperature is hygrothermal time (7). It is derived from a form of the Eyring (8) equation for rate change and Gibbs equation for free energy and is given by (3) Gibbs equation for free energy Where T is the termperature (K), R is the gas constant (J mol-1 K-1), Ea is the activation energy (J mol-1), B is the molecular volume ratio, aw is the water activity, and r0 is the rate at the standard state. In practice, the values for B, Ea/R and r0 will be unique to each situation and are derived empirically through least squares iteration. Once the constants are known, any temperature and water activity can be used with the hygrothermal time model to determine rate of oxidation at those conditions and hence the shelf life that the product will remain acceptable to the consumer.

MODE OF FAILURE – PHYSICAL STABILITY

For low water activity (0.20-0.40 aw) products such as snacks, dry pet food, and food powders, chemical reactions and microbial contamination are not the most likely modes of failure. However, these products also do not have unlimited shelf life. The most likely mode of failure for these dry products is a change in physical stability such as texture changes or caking for powders. Changes in water activity can affect both structure and texture and each product has an ideal water activity range where the texture will be optimal. To maximize shelf life, a product must be manufactured to its ideal water activity range and remain at that water activity during transport and storage. For most low water activity snacks, the expected texture is crisp and crunchy but if the water activity increases outside of the ideal range, they will become soft and undesirable. On the other hand, semi-moist products such as snack bars have higher water activity values and are expected to have a soft and pliable structure. If the water activity decreases outside the ideal range in semi-moist products, they will become hard and undesirable.

Figure 2. Loss of crispness in dry pet food due to changes in water activity at 3 different
  temperatures (10).
Figure 2. Loss of crispness in dry pet food due to changes in water activity at 3 different temperatures (10).

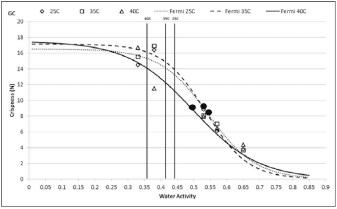
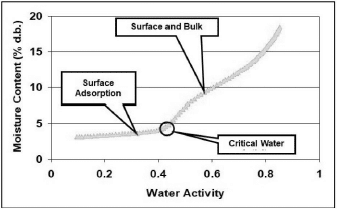
Investigations have shown documented changes in crispiness when equilibrating crisp products to various water activity values. (9, 10). Using both sensory panel data and instrumentation, the relationship between crispness, as sensed by the panel, and water activity was essentially linear, allowing identification of a water activity range where crispness changed from acceptable to unacceptable. In general, crisp products will maintain their texture until they move beyond the critical water activity where a sigmoidal loss in texture will occur (Figure 2).

One way that the water activity of products in the mid and low water activity range can change is due to moisture migration. This is a common problem in multi-component products. If the components are at different water activities, water will move between the components, regardless of the moisture content of the components. Water moves from high water activity (energy) to low water activity and not from high to low water concentration. If components are combined at different water activities, moisture migration will occur and could result in texture changes for each of the components. To avoid this problem, the components must be designed to be the same water activity. If components do have to be combined at different water activity levels, a model can be used to predict the final equilibrium water activity.

Figure 3. Dynamic isotherm of spray dried milk powder
Figure 3. Dynamic isotherm of spray dried milk powder showing an inflection point at a critical water activity of 0.43 aw. The high resolution of the dynamic method makes it possible to visualize inflection points in the curve. In the amorphous glassy state, sorption is limited adsorption, but the glass transition causes sorption to switch from surface to bulk absorption and results in a drastic sharpening of the isotherm curve (15).

For powders, caking or clumping during handling, packaging and storage is a ubiquitous problem. Caking is the formation of permanent clumps due to the stickiness of particles which eventually can result in a loss of functionality and lowered quality [11, 12]. Caking can reduce product recovery during drying, slow processing time by clogging up hoppers and pipes, thereby reducing product shelf life. Caking is water activity, time, and temperature dependent. Factors known to affect caking kinetics may be divided into intrinsic properties of the powder itself (water activity, particle size distribution, presence of impurities, and glass transition temperature) and external factors such as temperature, relative humidity and mechanical stress applied to the substance [13]. If the powder is an amorphous glass, a transition from the glassy to rubbery state will cause the powder to become susceptible to caking due to increased molecular mobility in the rubbery state [14]. Since the primary mode of preparation of powders is spray-drying, most of these powders are amorphous and glassy and the most likely reason for caking or clumping is due to a glass transition. The key then to preventing the caking of powders lies in establishing the critical water activity for glass transition and then preventing the water activity of the powder from exceeding that critical water activity (Figure 3).

IDEAL WATER ACTIVITY

The purpose of the investigations into the modes of failure listed in the previous sections is not only to hopefully predict shelf life, but also to identify the ideal water activity range for the product that maximizes its safety, quality, and shelf life. This ideal water activity then becomes the most important processing specification. It can be set to avoid microbial proliferation, minimize chemical reactions, and provide the desired textural properties. Meeting this ideal water activity requires an optimization of processing and formulation, and then continuous monitoring product for water activity. The most common processing steps for manufactured products is to remove moisture through drying. However, most products are sold on a weight basis, so removing water also reduces the weight of the product and results in lost revenue. Formulation adjustment can maximize the amount of moisture that can be held in a product at the water activity specification through the addition of humectants such as sugar, salt, and glycerin, which lower water activity without the removal of moisture. In addition, the careful monitoring of the water activity during production can reduce energy inputs and prevent undesirable weight loss due to processing to lower than ideal water activities. This will reduce energy waste while maximizing revenue. In summary, establishing an ideal water activity specification, formulating to meet that specification, and monitoring production with frequent water activity testing will ensure a safe, quality product with an optimal shelf life and maximum revenue.

MAINTAINING THE IDEAL WATER ACTIVITY: PACKAGING

Once the ideal water activity is identified that will maximize shelf life, it is critical that the product stay at that water activity during transit and storage. Water activity changes can occur due to exposure to ambient room humidity. As described in the theory section earlier, water activity is also the equilibrium relative humidity and related to the storage humidity. If a product with a water activity of 0.40 aw is exposed to a storage relative humidity of 60%, the product will absorb water from the environment until its water activity is equilibrated 0.60 aw. This process of course takes time, but if not protected, the water activity of the product will increase outside the ideal range and become soft. Placing the product in moisture barrier packaging will slow down the change in water activity. The moisture barrier properties of packaging are most often reported as water vapor transmission rates (WVTR) and should be available for any packaging material from the manufacturer. While it is certainly important to use packaging whose WVTR value is low enough to prevent water activity change, it is also is possible to overpackage resulting in unnecessary expense. The rate of water activity change inside a package of known WVTR can be modeled using Fickian diffusion, as can the required package permeability to achieve a desired shelf life (16).

THE MOST IMPORTANT SPECIFICATION

Shelf life testing and determination can seem overwhelming, but the shelf life simplified concepts discussed in this paper can facilitate the process. The idea is to avoid spending time investigating modes of failure that are not likely for your product based on the expected water activity and then identifying the ideal water activity range based on straightforward experimental testing. Finally, the ideal packaging that will ensure the desired shelf life can be identified based on its ability to maintain the ideal water activity regardless of the storage conditions.

The Author

Dr. Brady Carter is a Senior Research Scientist with Carter Scientific Solutions. He specializes in Water Activity and Moisture Sorption applications. Dr. Carter earned his Ph.D. and M.S Degree in Food Engineering and Crop Science from Washington State University and a B.A. Degree in Botany from Weber State University. He has 20 years of experience in research and development and prior to starting his own company, he held positions at Decagon Devices and Washington State University. Dr. Carter currently provides contract scientific support to Novasina AG and Netuec Group. He has been the instructor for water activity seminars in over 23 different countries and has provided on-site water activity training for companies around the world. He has authored over 20 white papers on water activity, moisture sorption isotherms, and complete moisture analysis. He has participated in hundreds of extension presentations andhas given talks at numerous scientific conferences. He developed the shelflife simplified paradigm and hygrothermal time shelf life model.
REFERENCES
  1. Grant, W. 2004. Life at low water activity. Philosophical Trans of the Royal Soc London 359:1249-1267.
  2. Beuchat, L. 1983. Influence of water activity on growth, metabolic activities and survival of yeasts and molds. Journal of Food Protection 46(2):135-141.
  3. Scott, W. 1957. Water relations of food spoilage microorganisms. Advances in Food Research 7:83-127.
  4. Leistner, L. 1985. Hurdle technology applied to meat products of the shelf stable product and intermediate moisture food types. In Properties of Water in Foods pg. 309-329. Martinus Nijhoff Publishers, Boston, MA.
  5. Stewart, C.M., Cole, M.B., Legan, Slade, L., Vandeven, M.H., and Schaffner, D.W. 2002. Staphylococcus aureus growth boundaries: moving towards mechanistic predictive models based on solute-specific effects. Applied and Environmental Microbiology 68:1864-1871.
  6. Bell, L. and Labuza, T. 1994. Influence of the low-moisture state on pH and its implication for reaction kinetics. Journal of Food Engineering 22:291-312.
  7. Carter, B. P., Syamaladevi, R. M., Galloway, M. T., Campbell, G. S., & Sablani, S. S. 2017. A Hygrothermal Time Model to Predict Shelf Life of Infant Formula. In U. Klinkesorn (Ed.), Proceedings for the 8th Shelf Life International Meeting (pp. 40–45). Bangkok, Thailand: Kasetsart University.
  8. Eyring, H. 1936. Viscosity, plasticity, and diffusion as examples of absolute reaction rates. J. Chem. Phys. 4:283.
  9. Katz, E.E. and Labuza, T.P. 1981. Effect of water activity on the sensory crispness and mechanical deformation of snack food products. Journal of Food Science 46, 403.
  10. Carter, B.P., Galloway, M.T., Campbell, G.S., and Carter, A.H. 2015. The critical water activity from dynamic dewpoint isotherms as an indicator of crispness in low moisture cookies. Journal of Food Measurement and Characterization 9(3):463-470.
  11. Bell, L. N., & Labuza, T. P. (2000). Moisture sorption: practical aspects of isotherm measurement and use (Vol. Second). St. Paul, MN: American Association of Cereal Chemists.
  12. Saltmarch, M., & Labuza, T. P. (1980). Influence of relative humidity on the physicochemical state of lactose in spray-dried sweet whey powders. Journal of Food Science, 45(5), 1231–1236,1242.
  13. Tsourouflis, S., Flink, J. M., & Karel, M. (1976). Loss of structure in freeze-dried carbohydrate solutions: effect of temperature, moisture content and composition. Journal of the Science of Food and Agriculture, 27, 509–519.
  14. Peleg, M., & Mannheim, C. H. (1977). The mechanism of caking of powdered onion. Journal of Food Processing and Preservation, 1, 3–11.
  15. Carter, B. P., & Schmidt, S. J. (2012). Developments in glass transition determination in foods using moisture sorption isotherms. Food Chemistry, 132(4), 1693–1698.
  16. Labuza, T.P. and Altunakar, B. 2007. Diffusion and sorption kinetics of water in foods, pp. 215-239 in Water Activity in Foods, edited by G. Barbosa-Canovas, A. J. Fontana, S. J. Schmidt and T. P. Labuza. Blackwell Publishing and IFT, Ames, Iowa.

The information contained within the application note was accurate at the time of publication.

For further information on Novatron’s range of water activity products or to discuss water activity within your application, please contact us on:

Phone: +44(0)1403 754416
Email: [email protected]

Novatron's Products and Services